2022 proved to be quite a year between the world getting ever more back out to amusement parks, and enthusiasts catching up on rides they had been missing during quarantine. And it showed: this year's tabulation was the largest ever of CFer entries! What's more, this also marks the fifth year @Pokemaniac, @Hixee, and I have collaborated to bring you, the dedicated public, our next crack of cutting-edge calculations to determine which roller coaster is on top as we head into 2023!
We admittedly had a little too much eggnog adding up rankings during the holiday season (And maybe got carried away for New Years and preparing for Valentine's Day), but we are excited to show our findings! Props as always goes to @Pokemaniac for assembling all submitted member Top 10's, and @Hixee for helping with other graphical, editorial, professorial, and notarial support.
Methodology
One of the most visited threads in the General Discussions section of the forums is the "Top 10-ish" thread, where people rank their ten (or more) most favourite coasters. We have combed through the thread and collected all the Top 10 lists posted over the past year, from November 1, 2020 to October 31, 2021ish (given the lower turnout, we let others sneak under the radar this year). Let us compare details on CF's top 25!
The Top 25
Key Thoughts/Takeaways
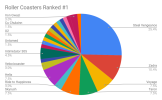
As usual, we have a few graphs to break down further CF's top roller coasters, which you can view in the full spreadsheet link at the end of the post. For starters, here is a map of the average roller coaster ranking vs. the number of rides. The higher a roller coaster is charted towards the upper left, the higher it is in the ranking. I have also added a trend line to add further clarity:
As was the case last year, charting out the roller coaster average rankings by the number of rides shows a high correlation with their ranking. Steel Vengeance still takes a definitive runaway victory, each way we slice the chart!
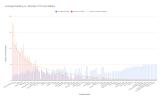
You may notice a number of roller coaster that have different average rankings vs. average rankings/rides. If we ranked roller coasters based on average rank alone, it would be a rather different result. Overall, we still prefer to consider the number of rides, to help ensure the rankings are reflective of the entire community vs. a few select members. This shows further skewing this year especially, as everyone's travels were greatly disrupted, limiting access and travel to new roller coasters.
Year-Over-Year Trends
For year-over-year, I highlighted a few key observations above. Some other good takeaways:
Sample Size is Everything
Again, this heavily relies on sample size, and how folks responded with their top 10 rankings. If you feel like a roller coaster got cheated and didn't participate this year, make it a point to drop your top 10 into the thread so we can count it towards next year's count!
We also updated the alternate rankings as we did last year, showing variations to how roller coaster rankings can be measured, such as logging results (to consider strong outliers) and removing top and bottom-most votes for each respective roller coaster (also as a control for outlier votes). A word of warning, the traditional outlier ranking is a bit skewed this year, due in part to a lower sample size (jumping back to having a lot of single rider entries).
Comparing to Other Polls
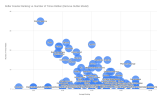
While we have used the ElloCoaster polls for comparison in years past, they have unfortunately been shuttered the last three years. @coasterbot however had a great turn out in their new rankings (https://coasterbot.com/votecoasters), which we added as a final comparison. Overall, the rankings still relatively close to each other, an average of 11 slots difference between the two polls with a correlation of 24% - a big dive from years past. Is CF onto something breaking? Interesting to see that even with two quite-different polling approaches, you can still see a similar overall trend. (Again, due in part to sample size)
Check Out the Full Rankings!
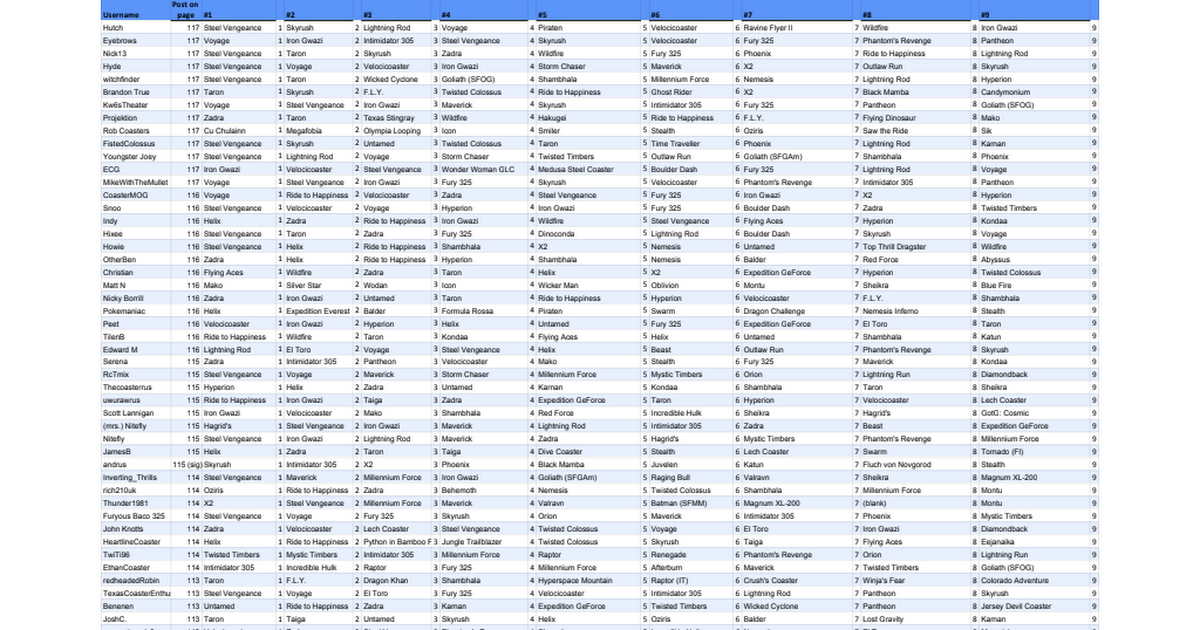
You can peruse all the data and tables here:
 docs.google.com
We admittedly had a little too much eggnog adding up rankings during the holiday season (And maybe got carried away for New Years and preparing for Valentine's Day), but we are excited to show our findings! Props as always goes to @Pokemaniac for assembling all submitted member Top 10's, and @Hixee for helping with other graphical, editorial, professorial, and notarial support.
Methodology
One of the most visited threads in the General Discussions section of the forums is the "Top 10-ish" thread, where people rank their ten (or more) most favourite coasters. We have combed through the thread and collected all the Top 10 lists posted over the past year, from November 1, 2020 to October 31, 2021ish (given the lower turnout, we let others sneak under the radar this year). Let us compare details on CF's top 25!
The Top 25
| Rank | Roller Coaster | Average Ranking | Average Ranking/Frequency | Number of #1 Rankings | Number of Rides |
| 1 | Steel Vengeance | 2.49 | 0.07 | 17 | 35 |
| 2 | Zadra | 3.13 | 0.13 | 7 | 24 |
| 3 | Voyage | 3.73 | 0.17 | 5 | 22 |
| 4 | Taron | 3.77 | 0.17 | 5 | 22 |
| 5 | Skyrush | 4.25 | 0.18 | 5 | 24 |
| 6 | Ride to Happiness | 3.68 | 0.19 | 2 | 19 |
| 7 | Helix | 3.61 | 0.20 | 5 | 18 |
| 8 | Velocicoaster | 3.78 | 0.21 | 2 | 18 |
| 9 | Iron Gwazi | 4.43 | 0.21 | 2 | 21 |
| 10 | Lightning Rod | 4.95 | 0.26 | 1 | 19 |
| 11 | Fury 325 | 6.00 | 0.26 | 0 | 23 |
| 12 | Intimidator 305 | 4.20 | 0.28 | 3 | 15 |
| 13 | Maverick | 5.06 | 0.32 | 1 | 16 |
| 14 | Untamed | 4.64 | 0.33 | 1 | 14 |
| 15 | Shambhala | 6.47 | 0.43 | 0 | 15 |
| 16 | El Toro | 6.08 | 0.47 | 1 | 13 |
| 17 | Hyperion | 7.07 | 0.47 | 1 | 15 |
| 18 | X2 | 5.27 | 0.48 | 1 | 11 |
| 19 | Millennium Force | 6.00 | 0.55 | 0 | 11 |
| 20 | Wildfire | 5.00 | 0.56 | 0 | 9 |
| 21 | Twisted Timbers | 6.45 | 0.59 | 1 | 11 |
| 22 | Nemesis | 5.67 | 0.63 | 1 | 9 |
| 23 | Phantom's Revenge | 8.46 | 0.65 | 0 | 13 |
| 24 | Phoenix | 7.22 | 0.80 | 0 | 9 |
| 25 | Expedition GeForce | 7.33 | 0.81 | 0 | 9 |
Key Thoughts/Takeaways
- A Surge of New Rides, Increasing Popularity - Each year we expect to see a number of "New for [XXXX] Year" roller coasters crack into the Top 25; Iron Gwazi made its own strong debut at #9 for 2022. However, we also saw New for 2021 Coasters in Ride to Happiness and VelociCoaster slide up into the Top 10, some of the biggest moves we have seen on the polls to date. A key driver to this is the number of riders, as our methodology in general is geared towards roller coasters with higher overall ridership taking strong positioning. As more enthusiasts make it to Florida for VelociCoaster and Iron Gwazi - watch out!
- Zadra,
Top Coaster in 2022?Still at #2 - Zadra has quickly climbed the rankings year over year since its debut at #16 in 2019. Last year, we forecast that Zadra could get the ridership count to finally dethrone Steel Vengeance (which has been consistent #1 ranking since the polls debut). Zadra however didn't seem that possible boost in ridership, keeping it stuck at 2. - Mack Breaks Up the RMC and Intamin Party - Ride to Happiness and Helix are the only two non-RMC-and-Intamin coasters in the Top 10, speaking volumes to their popularity against such stiff competition. It remains of note that B&M in turn continues to sit just outside of the top 10 since Fury 325 dropped out in 2021.
- What Do You Guys Know That I Don't? - There were some significant maneuvers by other roller coasters, especially Phantom's Revenge (18 slots up to #23), Millennium Force (17 slots up to #19), Mystic Timbers (20 slots up to #30), and F.L.Y. (15 slots up to #42). Jumps in coaster rankings due to noted trips or other refurbishments are always possible, but the level of randomness in these coasters is quite curious. Again, our methodology considers those who enter ballots, which also makes us susceptible for those Phantom's Revenge fans to run the polls - but still, with the largest turnout ever, fascinating seeing such coaster moves!

As usual, we have a few graphs to break down further CF's top roller coasters, which you can view in the full spreadsheet link at the end of the post. For starters, here is a map of the average roller coaster ranking vs. the number of rides. The higher a roller coaster is charted towards the upper left, the higher it is in the ranking. I have also added a trend line to add further clarity:
As was the case last year, charting out the roller coaster average rankings by the number of rides shows a high correlation with their ranking. Steel Vengeance still takes a definitive runaway victory, each way we slice the chart!

You may notice a number of roller coaster that have different average rankings vs. average rankings/rides. If we ranked roller coasters based on average rank alone, it would be a rather different result. Overall, we still prefer to consider the number of rides, to help ensure the rankings are reflective of the entire community vs. a few select members. This shows further skewing this year especially, as everyone's travels were greatly disrupted, limiting access and travel to new roller coasters.
Year-Over-Year Trends
For year-over-year, I highlighted a few key observations above. Some other good takeaways:
- Zadra continues to jump up in the rankings, after three continuous years of upward movement!
- RMC has locked in #1 and #2, but Gravity Group has reached an all-time high of #3 with Voyage. Holiday World must be giving extra love to their Woodie!
- Oh where oh where did Lightning Rod go? A previous top 5 finisher has fallen hard to #10.
- Overall, a lot of jockeying for position in the teens; is partly reliant on polling response and turnout.
| Roller Coaster | 2018 | 2019 | 2020 | 2021 | 2022 | Change From Previous Year |
| Steel Vengeance | 1 | 1 | 1 | 1 | 1 | 0 |
| Zadra | - | 16 | 6 | 2 | 2 | 0 |
| Voyage | 8 | 5 | 7 | 5 | 3 | 2 |
| Taron | 3 | 2 | 2 | 4 | 4 | 0 |
| Skyrush | 4 | 6 | 4 | 6 | 5 | 1 |
| Ride to Happiness | - | - | - | 15 | 6 | 9 |
| Helix | 7 | 3 | 5 | 7 | 7 | 0 |
| Velocicoaster | - | - | - | 20 | 8 | 12 |
| Iron Gwazi | - | - | - | - | 9 | - |
| Lightning Rod | 2 | 4 | 3 | 3 | 10 | -7 |
| Fury 325 | 11 | 9 | 10 | 17 | 11 | 6 |
| Intimidator 305 | 25 | 15 | 35 | 21 | 12 | 9 |
| Maverick | 4 | 11 | 11 | 11 | 13 | -2 |
| Untamed | - | 8 | 9 | 9 | 14 | -5 |
| Shambhala | 14 | 17 | 8 | 13 | 15 | -2 |
| El Toro | 10 | 7 | 12 | 8 | 16 | -8 |
| Hyperion | 58 | 19 | 18 | 10 | 17 | -7 |
| X2 | 8 | 18 | 15 | 19 | 18 | 1 |
| Millennium Force | 16 | 24 | 48 | 36 | 19 | 17 |
| Wildfire | 21 | 10 | 21 | 30 | 20 | 10 |
| Twisted Timbers | 22 | 23 | 32 | 24 | 21 | 3 |
| Nemesis | 13 | 12 | 14 | 12 | 22 | -10 |
| Phantom's Revenge | - | 39 | 44 | 41 | 23 | 18 |
| Phoenix | 28 | 30 | 25 | 25 | 24 | 1 |
| Expedition GeForce | 18 | 14 | 22 | 18 | 25 | -7 |
Sample Size is Everything
Again, this heavily relies on sample size, and how folks responded with their top 10 rankings. If you feel like a roller coaster got cheated and didn't participate this year, make it a point to drop your top 10 into the thread so we can count it towards next year's count!
We also updated the alternate rankings as we did last year, showing variations to how roller coaster rankings can be measured, such as logging results (to consider strong outliers) and removing top and bottom-most votes for each respective roller coaster (also as a control for outlier votes). A word of warning, the traditional outlier ranking is a bit skewed this year, due in part to a lower sample size (jumping back to having a lot of single rider entries).

Comparing to Other Polls
While we have used the ElloCoaster polls for comparison in years past, they have unfortunately been shuttered the last three years. @coasterbot however had a great turn out in their new rankings (https://coasterbot.com/votecoasters), which we added as a final comparison. Overall, the rankings still relatively close to each other, an average of 11 slots difference between the two polls with a correlation of 24% - a big dive from years past. Is CF onto something breaking?
Check Out the Full Rankings!
You can peruse all the data and tables here:

